Ever wondered which NHL players have scored against every opponent? This concept were are calling, the Goal Gauntlet.
On Thursday, November 6 the Dallas Stars played against the Anaheim Ducks. Pregame, Dallas Stars beat writer Lia Assimakopoulos tweeted that Tyler Seguin had never scored a regular season goal against the Anaheim Ducks. That night he did end up scoring, which led me down the rabbit hole of wondering, which NHL players have scored against every possible opponent?
For this project, I began by going to Zmalski's GitHub page that outlines the NHL public API documentation (https://github.com/Zmalski/NHL-API-Reference), and started a new project in Cursor. I won't post the full code, but I will share my thought process and strategy in ensuring the AI was able to assist me in getting the results I wanted.
1. I began by skimming the documentation and thought through the easiest way to gather the goal scoring data that I wanted - which was by pulling box scores of individual games.
2. In order to pull boxscores from the API, you are required to have a gameID. This leads to a few additional steps. In order to make a dataset of all the gameID's for the seasons I want is by pulling each team's full season of games together. Doing so also requires you to have a list of the team's abbreviated name for the API as well.
3. So after understanding this, I had Cursor put together a script to pull the current NHL standings, which would yield me the easiest route of getting the team names and the associated abbreviated name alongside. From there I created a secondary script that would allow me to pull together the full team's schedule for each team, and additionally rerun for whatever specific season I wanted.
4. Now that I have the list of gameID's, all I needed to do was have a script pull each games results. Specifically looking for how many goals each player scored, what team they are on, who they played against, their player ID, and I kept a few additional details for other uses cases potentially (position, assists, points).
5. The number of seasons was determined by looking up who the oldest current active player is (Brent Burns) and which season he started playing (2003-2004). So I pulled the data for every season since then. And lastly, I needed to reduce my list of player's data to just those who are actively playing (for the visual I wanted to create) so I used my team abbreviations again and pulled the current roster for each team, including Player ID's.
6. Now that I have the data for all games and players for every active player's career, I just needed to combine everything into a single data frame, and have it summarized properly, then filtered down by active players.
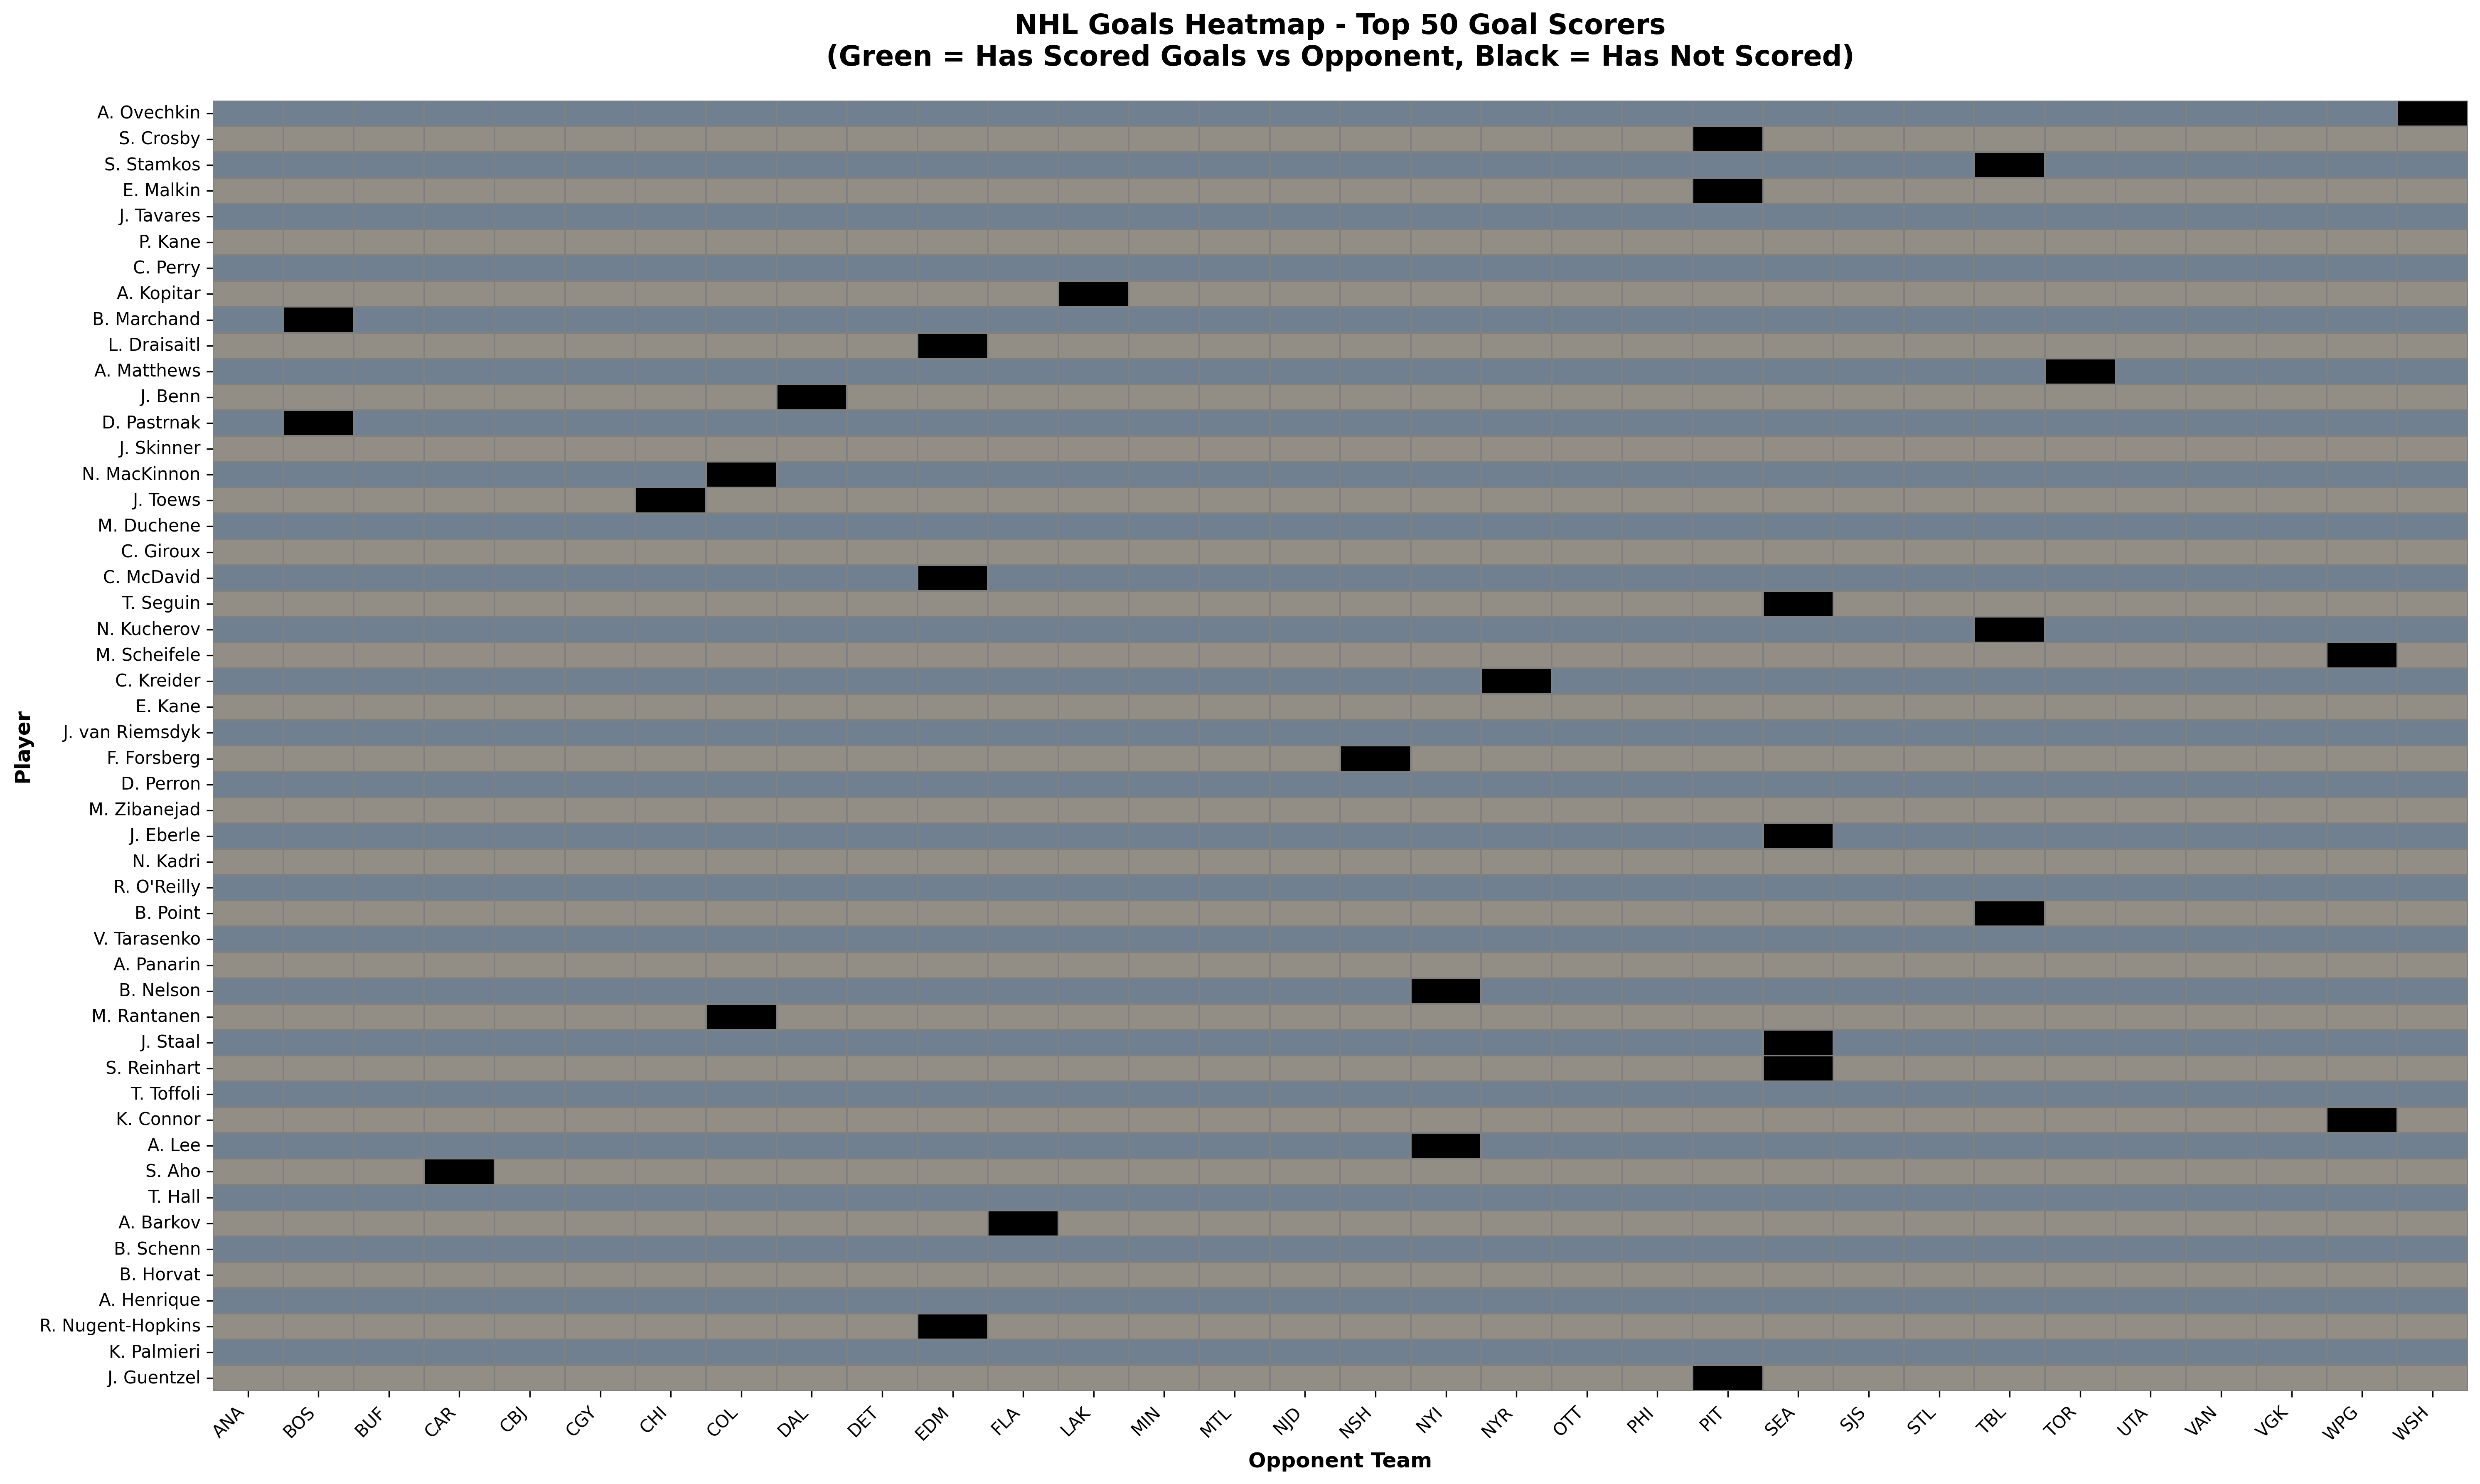
7. Cursor was able to assist with creating a nice visual aid that shows a color if the player (row) has scored against an opponent (column), and if they have not fill it in black. The visual here shows the top 50 career goal scorers, but could be expanded depending on wants.
As it turns out, Seguin still has one team to go, the Seattle Kraken.